Choose a country or region to view specific content for your location :
Collections
TAG Heuer
Carrera
Formula 1
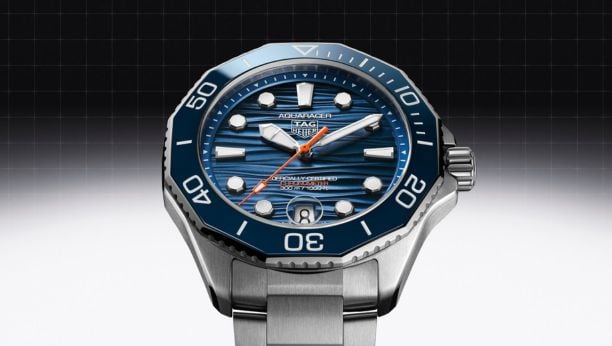
AQUARACER
MONACO
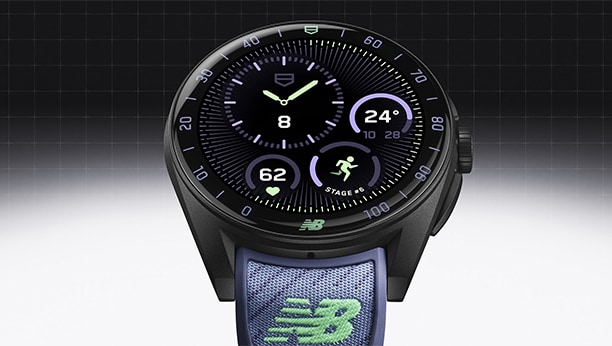
CONNECTED
LINK
FAQ
Find a store
Customer care
Contact us
* Mandatory fields
By logging into my account, I confirm that I have read and accept the Privacy Policy of TAG Heuer.
Free delivery & return
Premium Packaging
Authentic and certified watches