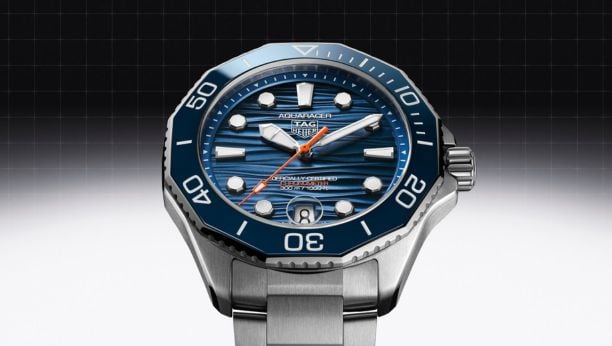
TAG HEUER CONNECTED USER GUIDE

TRACK YOUR ACTIVITY

Understand your activity data by learning about your Wellness metrics and getting all the keys to read graphs from your watch and Connected app.

Measure how active you are and view your history. Wellness app lets you track your heart rate, steps and calories as well as your goals, and measure the intensity of your activities. Find out here how to read and understand your stats to know everything about your performance.

image1
STEP 1

Open Wellness on your phone

To get started, launch TAG Heuer Connected on your phone and tap the circular icon at the bottom of your screen to open Wellness. From Wellness interface on your mobile app, you will be able to track your steps and calories, see how close you are to your goals, track your heart rate, measure your performance and view your Wellness history by day, week, month and year. If needed, swipe down from the top of your screen to load your watch latest data.

image1
STEP 2

Discover your Wellness metrics

Swipe up to the bottom of the page and tap 'Learn more about Wellness metrics' to read about your Daily Goals, Steps, Active Calories and Active Time. Now let's find out your metrics and stats on your watch and phone.

image3
STEP 3

Track your activity

Press the bottom button to open TAG Heuer Wellness on your watch and view your live heart rate, active time, and daily steps and calories. In the center of the screen you will find your live heart rate. Heart rate is measured by an optical sensor once per second. The orange and white rings represent your daily steps and calories: the full circles stand for the goals set in your Wellness profile, and the brighter arrows show how close you are to achieving them. These counters are reset at midnight.

image4
STEP 4

View your steps

Swipe up on your watch screen to learn more about your step count. At the top left is the number of steps taken since the beginning of the day, and on the right, the percentage achieved compared to your goals. In the center, the diagram represents your steps during the day. Each bar is worth one hour. The upper dotted line is the most steps recorded for an hour during the day, and the middle line is half that value.

image5
STEP 5

Check your calories

Swipe up to display the Calories view. In the upper part are displayed your calories burned since the beginning of the day and how much it represents towards the goals you set in your Wellness profile. The central graph shows your calories burned for each hour of the day. The upper dotted line represents the maximum calories burned registered in an hour, and the middle line is half of this value.

Image6
STEP 6

Track your performance on your Connected app

You can also track your daily steps and calories in the upper part of the Wellness view. On the right, the Steps and Active Calories boxes provide information on the number of steps taken and calories burned since the start of the day. These values are related to your goals and illustrated on the rings on the left (see step 3 for details). Live heart rate is displayed just below. Tap either Steps or Active calories to access your daily view.

image7
STEP 7

Read your daily Steps & Calories details

The Steps & Calories view shows your number of steps and calories burned over a day. On the timeline, your steps are demonstrated in white and the calories in orange. Each bar represents a thirty-minute interval. Touch and hold the timeline to view step and calorie details for a thirty-minute timeslot. Hold down and move your finger or tap anywhere else on the graph to read information from another interval. Your goals are recalled on the diagram and synthetized above in the form of two rings (see step 3 for details). Finally, if you exercised during the day, an icon corresponding to your activity is displayed at the time you started you sports session. Swipe right to view the previous days and left to return.

image8
STEP 8

View your weekly Steps & Calories history

Tap the second tab to open the weekly Steps & Calories view. First line specifies which week you are viewing and below is your average number of steps and calories per day for this week. The graph summarizes your steps and calories for the week, day by day. The white and orange dotted lines correspond to your goals. When a bar reaches one of these lines, it means you achieved your step or calorie goal that day. The number of days you completed your goals is shown near the dotted lines. Touch and hold a day to view the average number of steps and calories for that day. Swipe right to view the previous weeks, and left to return.

STEP9
STEP 9

Get an overview of your monthly Steps & Calories

Press the third tab in the menu bar at the top of your app to access the monthly Steps & Calories view. Below the month name you will find your average number of steps and calories per day for that month. The chart shows your steps and calories for the month, day by day. Like for the weekly view, the white and orange dotted lines represent your goals. A bar reaching one of these lines means that you completed your step or calorie goal that day. The number of days you reached your goals can be seen near the dotted lines. Touch and hold a bar to view average steps and calories for that day. Swipe right to take a look at the previous months and left to retrace your steps.

STEP 10

Find out your yearly step and calorie summary

Press last tab from the menu bar to view your yearly Steps & Calories. In the upper part, access your average number of steps and calories per day over a year. On the chart, your step and calorie goals are shown as dotted lines (see steps 8 and 9 for details) with each bar represents a month. The number of days you reached your goals is displayed above and below. If you have been using your TAG Heuer Connected for more than a year, swipe right to see the previous year and left to go back.

STEP11
STEP 11

Access your recent and best workouts

Sports sessions done with your watch appear below the timeline. You will find your workouts day by day in the daily view, and your best performances for the selected week, month or year. Tap a session to find out more or the back arrow on the top left corner to return to Wellness main page.

STEP12
STEP 12

Edit your goals

Your steps and calorie goals can be updated on your watch as well as from any Wellness view on your mobile app (tap 'Goals' at the top right of the screen). For step-by-step guidance, see 'Update your profile and goals' in Wellness user guide.

UPDATE YOUR PROFILE AND GOALS
STEP13
STEP 13

View your heart rate info

Press your watch bottom button and scroll up several times to discover your heart rate information. Find your live heart rate to the left of the heart icon. It beats at the recorded bpm. Indicated average and range values are calculated from the beginning of the day to the current time, based on averages established over five-minute periods. All Wellness information leaning on your heart rate, that is to say daily, weekly, monthly and yearly graphs, averages and ranges as well as active time, is based on this five-minute unit. It will be mentioned regularly.

STEP14
STEP 14

Track your heart rate over the day

Swipe up again to see changes in your heart rate throughout the day. On the graph, the hours are on the abscissa, they are added during the day, and the beats per minute on the ordinate. Each point on the curve corresponds to the average heart rate measured over five minutes for the period it encompasses.

STEP15
STEP 15

Check your heart activity on your phone

On your mobile app, you can visualize your heart rate data in the Wellness view. The graph displays your heart rate over the day – the curve will continue to draw as the hours go by, with minimum and maximum values. As on your watch (see step 14), each point on the chart corresponds to an average heart rate measured over five minutes. Tap your heart rate or the curve to read details and interact with the chart.

STEP16
STEP 16

View your heart rate for the day

The daily view shows the date of the day you are looking at and heart rate average and range values, from the start to the end of the day. These values are assigned from averages measured over five-minute intervals, so the average for the day is calculated by cumulating the average values of all five-minute periods of which it is composed. The minimum and maximum ranges correspond to the five minutes for which the average was the highest and the lowest. The colors on the curve make reference to the Active Time zones visible under the graph and help you visualize your most active times of the day (see from step 20 for more information). Workouts are marked with an icon on the curve. Long press the chart to display your heart rate details for a 15-minute period. Hold down and move your finger or tap somewhere else on the timeline to switch to another time slot. Swipe right to view the previous days and left to return.

STEP17
STEP 17

See the evolution of your heart rate over a week

Press the second tab to open the weekly view and display your average and range heart rate over seven days. As with the daily stats, values are obtained from averages measured over periods of five minutes. The average for the week is calculated using the averages of all the five-minute intervals that compose it, and range minimum and maximum values correspond to the five minutes in the week for which the average was highest and lowest. A yellow dot on the chart shows your average heart rate for each day and colors correspond to the Active Time zones you can found below (see from step 20 for more information). Press and hold on a bar to read average and range values for a precise day. Swipe right to read about the previous weeks and left to come back.

STEP18
STEP 18

Get an overview of your heart rate over a month

Tap the third tab in the menu bar at the top of your app. The monthly view allows you to know your average and range heart rate over the number of days that make up the month. Values provided are calculated as for days and weeks, based on five-minute averaged periods (read steps 16 and 17 for details). Colors on the chart match the Active Time zones (see from step 20) and the yellow dot corresponds to the average for each day. Press and hold a bar to read average and range values for a specific day. Swipe right to view the preceding months and left to retrace your steps.

STEP19
STEP 19

Find out your yearly heart rate stats

The annual view can be reached by touching the last tab of the menu bar. The statistics provided cover the whole year (or the current year if it is not complete) and are measured in the same way as for days, weeks and months, by compiling averages established over five-minute intervals. The yearly average includes all five-minute periods of the different months, and the minimum and maximum values correspond to the intervals for which your heart rate was at its highest and its lowest. The colors on the graph match the Active Time zones detailed below (see from step 20 for more information) and the yellow dot figures your average heart rate for each month. Press and hold a bar to read average and range values for a specific month. If you have had your watch long enough, swipe right to view the previous year and left to return to the current year.

STEP20
STEP 20

About Active Time

Active Time measures the intensity of your activity. It uses your age and gender to determine your maximum heart rate and rank your efforts based on this measurement. Your Wellness app registers Active Time from 50% of your estimated maximum effort. It is then classified into three categories corresponding to 50-69% (Fat burn), 70-84% (Cardio) and 85-100% (Peak) of your maximum heart rate; Active Time zones indicate the time spent in each of these ranges of values. As active time is based on heart rate, it is also calculated from average heart rate values measured over five-minute timeslots (see steps 16 or 17 on this page). To read about Active Time zones, swipe up to the bottom of Wellness interface, tap 'Learn more about Wellness metrics' and scroll to the last slide.

STEP 21
STEP 21

Check your active time

To see your active time during the day, open Wellness app by pressing the bottom pusher on your watch and scroll down to the Active time screen. The top number totals the minutes spent in all activity zones since the start of the day. Peak, Cardio and Fat burn detail how this time is distributed.

STEP 22
STEP 22

Monitor your active time on your phone

To view your active time in TAG Heuer Connected app, open Wellness tab and swipe up. The Active Time section shows your activity day by day for the current week. Quickly identify your most active days by comparing the height of the colored bars. The orange (Cardio) and red (Peak) bars appear when you exercise and signal a higher heart rate. Total time spent in the three activity zones since the start of the week is listed at the top of the box. Fat burn, Cardio and Peak values specify the time spent at each intensity level. Tap anywhere in the Active Time frame to display details and history.

STEP 23
STEP 23

Discover your daily active time

Swipe up in the daily view to see your active time. As on your watch, discover your total number of active minutes and measure your performance thanks to the Peak, Cardio and Fat burn values. Learn what times you have been most active by referring to the red and orange colors on the graph curve. Swipe right on your heart rate chart to display active time from the previous days, and swipe right to return.

STEP 24
STEP 24

Find out your weekly active time

Tap the second tab in the menu bar to display your active time for the week. This section shows your cumulative active time over the different days of the week. Refer to the colors (red for Peak, orange for Cardio and yellow for Fat burn) on the chart above to identify the days when you were the most active. Swipe right on the heart rate chart to read your active time from the previous weeks, and swipe right to retrace your steps.

STEP 25
STEP 25

Check your average active time per week over a month

Touch the third tab to discover your monthly activity. Unlike the daily and weekly views, activity in the monthly and yearly sections is indicated as average active time per week. In the monthly view, it is measured from the beginning of the month until the fourth week (or the current week if the month viewed has not ended). Visualize your most active days thanks to the color code on the heart rate chart. Swipe right on it to display active time for the preceding months, and left to get back.

STEP 26
STEP 26

View your average active time per week over a year

In the yearly view, active time per week is measured from the first to the last week (or the current week if year is not completed). Pay attention to the color code to identify your most active months and swipe right or left to change year.

A question?

Don't hesitate to contact us.